


The recycling and reuse survey
In 2000, as part of a European Commission funded research project on Life Cycle Assessment (LCA) for steel construction[1], the Steel Construction Institute (SCI) undertook a survey of UK demolition contractors to estimate the recycling and reuse rates of common, generic steel construction products used in the UK. This survey provided, for the first time, robust estimates of recycling and reuse rates of steel construction products from the demolition of buildings. These data have been widely used and referenced and have been important in quantifying the whole-life or ‘cradle-to-cradle’ environmental impacts of steel products using internationally recognised (LCA) standards.
In 2012, Tata Steel, as part of a Eurofer led project, approached the UK National Federation of Demolition Contractors(NFDC) to conduct a survey to investigate again recycling and reuse rates. In terms of scope, the Eurofer survey was similar to the earlier SCI study. It was directed to Europe as a whole but most of the returns came from the UK. SCI took the results and interrogated the UK data before extending the scope of the survey. The purpose of this was to confirm, or otherwise, whether the existing data (from the 2000 survey) remained robust.
This article summarises the results of that work. Further details can be found in a paper titled Reuse and recycling rates of UK steel demolition arisings[2].
[top]Reuse and recycling

Pressure to reduce landfill and to avoid or substitute primary resources is focussing greater attention on the reuse and recycling of materials that arise when buildings are demolished. The recovery and beneficial reuse or recycling of the arisings when buildings are demolished or deconstructed is of growing importance in the UK and more widely throughout the EU. In particular, as policy to develop the circular economy evolves.
The UK has a target under the EU Waste Framework Directive[3] to reduce construction and demolition waste that is landfilled. Article 11.2b of the Directive stipulates that Member States shall take the necessary measures designed to achieve that by 2020 a minimum of 70% (by weight) of non-hazardous construction and demolition waste excluding naturally occurring material defined in category 17 05 04 in the List of Wastes shall be prepared for re-use, recycled or undergo other material recovery (including backfilling operations using waste to substitute other materials).
This 70% recovery target has been achieved in the UK, in fact, it is estimated that in 2016, 91% of construction and demolition waste was recovered. It is noted however, that most demolition waste is concrete and masonry products which is generally crushed and downcycled into general fill material. Although this avoids landfill, it does not replace new concrete or masonry products and therefore is low on the hierarchy of preferred waste management options.
When buildings are demolished or deconstructed, the outcome of the demolition arisings generally includes:
- Reuse – in which the salvaged construction component is reused in another application in essentially the same form. This can include some (generally minor) reprocessing.
- Recycling – in which the salvaged product or material is processed to produce a new material or product (this can be of the same or different function or quality)
- Incineration – with or without energy recovery
- Landfill.
Current estimates (2016) of construction and demolition waste suggest that 5Mt of inert waste are disposed of in landfill per year.
[top]Reuse and recycling rates
When discussing and assessing the environmental impacts and benefits of reuse and recycling, several different terms or metrics are often used. It is important to differentiate between these different terms not least because there is often misunderstanding (and sometimes misrepresentation) of how they are interpreted.
Common terminology in the debate includes:
- Recycled content
- Recycling rate (taken to be the building end-of-life rate in the context of this study)
- Recyclable
- Downcycling.
Differentiation between recycled content and recycling rate is particularly important since these metrics are used in fundamentally different ways to calculate the environmental impact of construction products.
ISO 14021[4] defines recycled content as the proportion, by mass, of recycled material in a product. Only pre-consumer and post-consumer materials shall be considered as recycled content, consistent with the following usage of the terms:
- Pre-consumer material: Material diverted from the waste stream during a manufacturing process. Excluded is reutilisation of materials such as rework, regrind or scrap generated in a process and capable of being reclaimed within the same process that generated it.
- Post-consumer material: Material generated by households or by commercial, industrial and institutional facilities in their role as end-users of the product, which can no longer be used for its intended purpose. This includes returns of material from the distribution chain. For the purposes of the calculation, the term 'product' refers to the final product as delivered to the construction site and incorporated in the works.
The end-of-life recycling rate is the percentage of post-consumer scrap arising (in the context of the study, from demolition) that is actually recycled.
As a term, recyclable has very little meaning since, in theory at least, virtually all products are recyclable, i.e. they are capable of being recycled/downcycled. Recyclability is therefore a theoretical maximum measure of what can be recycled; which explains why many products are often described (by their manufacturers) as 100% recyclable. The term is not used in any formalised way for quantifying the environmental impacts of products.
Downcycling is a term used to refer to the recycling process when the resultant material is of a lower quality than the original source. A common example of downcycling in construction is the crushing of concrete to produce hardcore. Crushing and downcycling concrete does avoid landfill but does not substitute new concrete production. The cement, which makes by far the biggest contribution to the CO2e emissions of concrete, is lost in the crushing and downcycling process.
The separation between recycling and downcycling is important in the context of demolition arisings since it differentiates metals from almost all other common construction materials. For example, metals are recycled back into functionally equivalent products whereas materials, including concrete and timber, are generally downcycled into lower grade products such as hardcore, chipboard, etc. It is apparent that recycling and reuse yield a greater environmental benefit than downcycling and should be factored into whole-life environmental comparisons between construction products.
[top]Definitions of recycling and reuse rates
Derivation of accurate reuse and recycling rates for construction products is difficult. The recycling rate for steel construction products from demolition can be defined as the tonnage of steel construction products arising from demolition, which is re-melted, divided by the tonnage of steel construction products arising from demolition.
The reuse rate is similarly defined by replacing the word ‘re-melted’ by ‘reused’.
In the case of steel products, although data are available for scrap consumption, imports and exports in the UK, it is far more difficult to establish the tonnage of steel construction products arising from demolition activities, i.e. the denominator in the definition above. In addition, the UK scrap grading system is not sufficiently refined to accurately quantify the tonnage of steel construction products re-smelted. Furthermore, given both the size and nature of the demolition industry, accurate quantification of the tonnage of steel construction products arising on demolition sites is currently not possible.
It is for these reasons that, instead of attempting to quantify both the tonnage of construction steel arising from demolition and the tonnage of construction steel (from demolition) actually re-melted, surveys of demolition contractors have been undertaken to establish estimates of reuse and recycling rates.
[top]The 2000 Survey
As part of the European research project [1] , a questionnaire was sent out to NFDC member companies in November 2000. The NFDC cooperated with SCI by providing the database of addresses of their members and allowing the use of the NFDC logo on the questionnaire.

The questionnaire consisted of three questions; the first two were intended to derive information on the number and type of buildings demolished over the past 12 months by respondents to the survey. The third question asked respondents to estimate, as a percentage of the amount arising, how much construction steel was recycled, reused and landfilled for the following generic construction products:
- Heavy structural steel
- Secondary structural steel, e.g. purlins, rails, etc.
- Cladding
- Composite floor decking
- Concrete reinforcing bars
- Internal non-structural steel, e.g. service ducting.
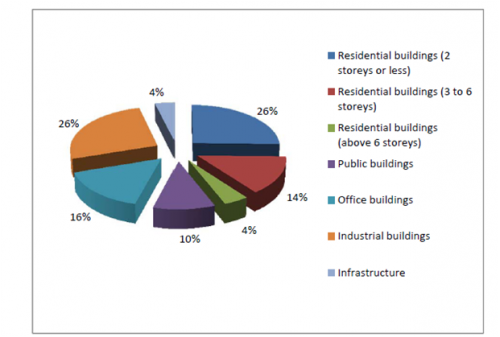
Responses were received on 44 buildings, and the breakdown by type is shown.
The average of all the 44 responses to the survey for each generic product considered are also shown. Note that these are mean values based on the responses of all 44 respondents; i.e. they are not weighted in any way and do not take into account the size of the demolition contractor or the number of buildings demolished over the 12 month reporting period.
| Structural sections | Light gauge steel | Cladding | Metal floor decking | Rebar | Internal non-structural steel | |
|---|---|---|---|---|---|---|
| Recycling % | 86 | 89 | 79 | 79 | 91 | 85 |
| Re-use % | 13 | 10 | 15 | 6 | 1 | 2 |
| Landfill % | 1 | 1 | 6 | 15 | 8 | 13 |
The following observations and comments are made on these values:
- The recovery for primary and secondary structural steel was consistent at 98% and 99% respectively.
- No differentiation was made (in the survey) between the reuse and recycling rates of built-up and composite steel-based cladding systems.
- It is thought unlikely, given the age of most steel composite floor buildings (the construction method was introduced into the UK in the mid-1980s), that many (if any) respondents would have had experience in demolishing such buildings in 2000. As such, the values for composite floor decking were not necessarily robust.
- The rebar reuse and recycling rate was higher than might have been expected at that time but showed that concrete crushing and some form of downcycling, was already commonplace in 2000.
This data was also published as part of as Engineering Doctorate thesis which investigated material flow analysis of the UK steel construction sector and circulated widely in conference papers[5].
[top]The 2012 Eurofer survey of NFDC Members
In July 2012, as part of a Eurofer survey of EU member states to quantify the percentage of steel in buildings that is recovered from a typical building demolition site, Tata Steel RD&T undertook a similar UK survey to that carried out in 2000.
The survey asked the demolition contractor for their expert opinion on the proportion of the following steel construction products that they recover:
- Heavy structural steel sections
- Rebar (in concrete super structure)
- Rebar (in concrete sub-structure or foundations)
- Steel piles (sheet or bearing)
- Light structural steel (e.g. galvanised purlins, supports etc.)
- Profiled sheet cladding (roof / façade)
- Internal light steel (e.g. plaster profiles, door frames)
- Other (e.g. stainless steel - if different from above).
The balance was assumed to be not recovered, i.e. lost.
The average reuse and recycling rate estimates for steel demolition arisings based on the survey responses are shown. The values in the table are straight averages, i.e. mean values, of the returns from NFDC members.
| Product | % Reused | % Recycled | % Lost |
|---|---|---|---|
| Heavy structural sections/tubes | 7 | 93 | 0 |
| Rebar (in concrete superstructures) | 0 | 98 | 2 |
| Rebar (in concrete sub-structure or foundations) | 2 | 95 | 2 |
| Steel piles (sheet and bearing) | 12 | 73 | 15 |
| Light structural steel | 4 | 94 | 2 |
| Profile steel cladding (roof/facade) | 9 | 90 | 1 |
| Internal light steel (e.g. plaster profiles, door frames) | 0 | 95 | 5 |
| Other (e.g. stainless steel) | 1 | 98 | 1 |
| Average (across all products) | 4 | 92 | 4 |
[top]Additional NFDC survey returns from 2013
As a follow up to the 2012 project, the NFDC reviewed the list of the companies who had responded to the Eurofer survey in 2012 and suggested additional members for SCI to approach. This was done in March 2013. The summary results from the NFDC survey based on the responses received in 2012 and the additional responses received in Q1 2013 are shown.
| Product | % Reused | % Recycled | % Lost |
|---|---|---|---|
| Heavy structural sections/tubes | 7 | 93 | 0 |
| Rebar (in concrete superstructures) | 0 | 98 | 2 |
| Rebar (in concrete sub-structure or foundations) | 2 | 95 | 2 |
| Steel piles (sheet and bearing) | 15 | 71 | 14 |
| Light structural steel | 5 | 93 | 2 |
| Profile steel cladding (roof/facade) | 10 | 89 | 1 |
| Internal light steel (e.g. plaster profiles, door frames) | 0 | 94 | 6 |
| Other (e.g. stainless steel) | 4 | 95 | 1 |
| Average (across all products) | 5 | 91 | 4 |
[top]Comparison between the 2000 and the 2012 surveys
A comparison between the reuse and recycling rates obtained from the 2000 and the 2012 surveys is shown. Note that the product definitions differed between the two surveys and therefore the table only includes the products common to both surveys.
| Productc | % Reused | % Recycled | % Lost | |||
|---|---|---|---|---|---|---|
| 2001 | 2012 | 2001 | 2012 | 2001 | 2012 | |
| Heavy structural sections / tubes | 12 | 7 | 87a | 93 | 1 | 0 |
| Rebar (in concrete superstructure) | 2 | 0 | 90a | 98 | 8 | 2 |
| Light structural steel (e.g. galvanized purlins, supports etc.) | 10 | 5 | 89 | 93 | 1 | 2 |
| Profiled sheet cladding (roof / facade) | 15 | 10 | 79 | 89 | 6 | 1 |
| Other non-structural steelb | 2 | 4 | 85 | 96 | 13 | 1 |
| Average (across all products) | 8 | 5 | 85 | 91 | 7 | 4 |
Notes:
a It is assumed that the ‘export’ proportion of the 2000 survey is recycled.
b The product grouping is not an exact match between the two surveys.
c Note that the product groups covered differed in the two surveys.
In terms of overall reuse and recycling rate, the 2012 survey shows an improvement over the 2000 results. The 2012 results show that, on average, 96% of steel construction products from demolition are either reused or recycled compared to 93% from the 2000 survey. Across all product groups, reuse rate estimates are down compared to the 2000 survey but this decrease is more than compensated by the increase in estimated recycling rate . In terms of heavy structural steel, the 2012 survey shows that 100% of demolition arisings are either reused or recycled. However, for practical purposes a 99% recycling/reuse rate is generally assumed in order to account for small losses of material during the lifecycle of the product.
[top]References
- ↑ 1.0 1.1 Life-cycle assessment (LCA) for steel construction. Final report. Sansom, M and Meijer, J. Published by the European Commission
- ↑ Reuse and recycling rates of UK steel demolition arisings. Sansom, M. and Avery, N. Proceedings of the Institution of Civil Engineers Engineering Sustainability 167, June 2014, Issue ES3
- ↑ Directive 2008/98/EC of the European Parliament and of the council of 19 November 2008 on waste and repealing certain Directives
- ↑ BS EN ISO 14021:2016 Environmental labels and declarations. Self-declared environmental claims (Type II environmental labelling). BSI
- ↑ J Davis, R Geyer, J Ley, J He, R Clift, A Kwan, M Sansom, and T Jackson. Time-dependent material flow analysis of iron and steel in the UK Part 2: Scrap generation and recycling. Resources Conservation & Recycling, 51:118–140, 2007
[top]See also
- Recycling and reuse
- Sustainability
- Construction and demolition waste
- The case for steel
- Life cycle assessment and embodied carbon
- Steel construction products
- Floor systems
- Steel and the circular economy